Journey of Women over last 5 decades dashboard
Tableau Public LinkUniversity of Washington Sep 2019 - Dec 2019
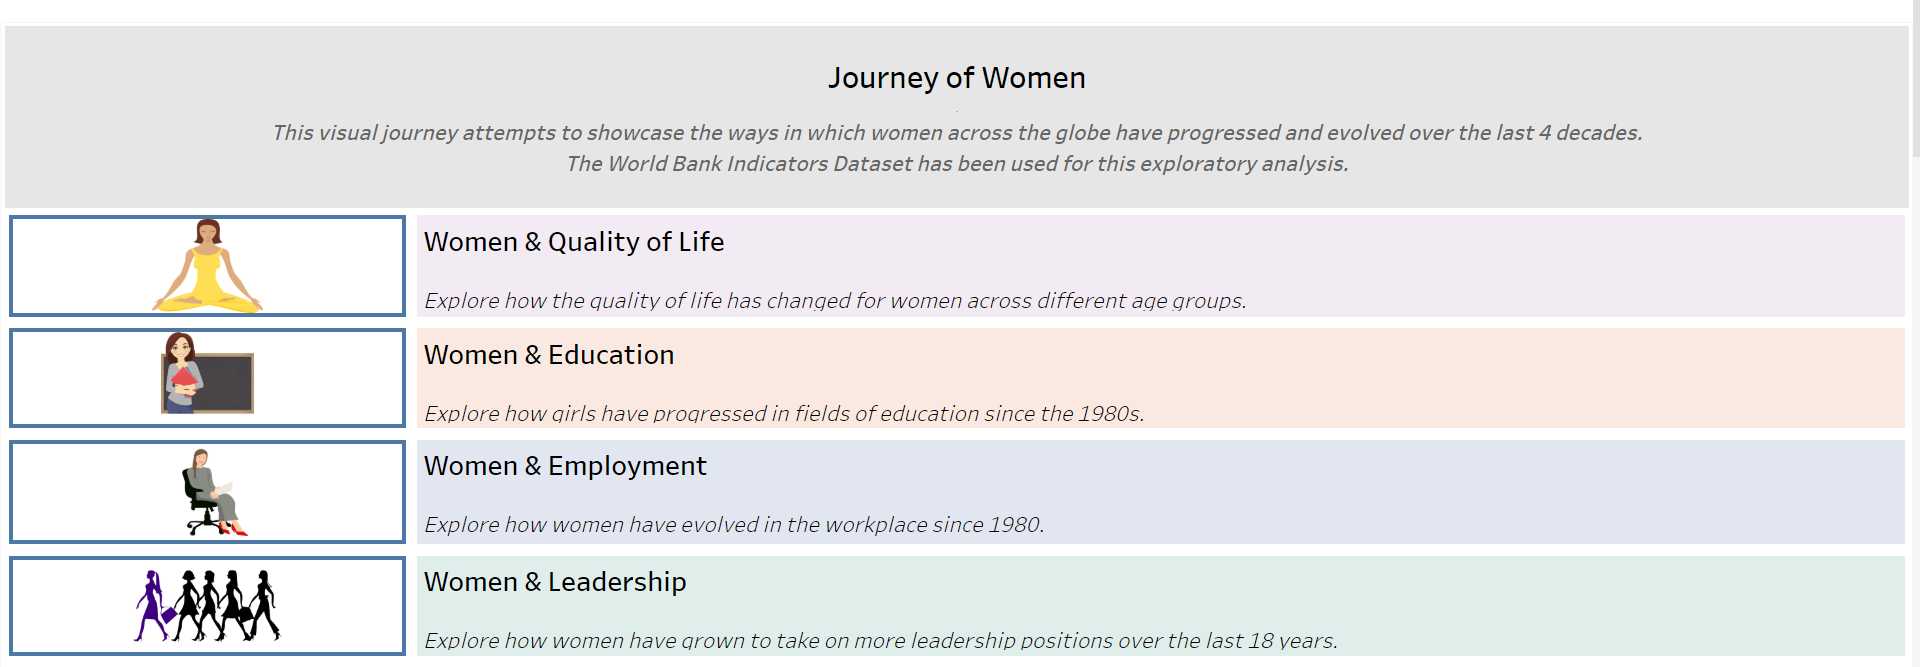
The ‘Journey of Women’ is an exploratory visual analysis built using Tableau based on the indicators related to women from the World Bank dataset. This visual product aims to provide means to learn how paradigms have changed for women globally over the last 5 decades in areas such as education, quality of life, employment, and leadership roles.
Data Collection
The WDI data files contain the indicators for 58 years ranging from the years 1960 through 2018. It contains data for 264 countries (including regions) for a total of 1,432 indicators. Link to the data source. For our visual story, we shortlisted 27 relevant indicators that focus on our 4 areas of interest: quality of life, education, employment and leadership for women. We used the ‘Tableau Prep Builder’ tool for cleaning the data and preparing it for the final dashboard.
Experiments
We brainstormed ideas during the 5 design sheets exercise to align on the framework of the dashboard. We aligned on creating 4 views to answer the questions raised during information gathering.
- Women & Quality of Life
- Women & Education
- Women & Employment
- Women & Leadership
Result and Conclusion
We want to paint a realistic picture of the situation as it is today. We understand that some areas will need more help than others to ensure women are on par with men, at the least. While in some areas, women might have managed to make things fair and better. “Humans are allergic to change. They love to say, ‘We’ve always done it this way.’ I try to fight that. That’s why I have a clock on my wall that runs counter-clockwise.” – Grace Hopper. Our hope is that this interactive visual tool can stir some change in society.