Time Series Forecasting
Github LinkDelhi Technological University Jan 2015- Jun 2015
This project has been taken to get to know about time series forecasting. It explores the various models that can be applied to time series data. We wanted to visually interpret the translation of the various components if the time series. It shows the MICROSOFT EXCEL implementation of these models as well as compares the result coming from ZAITUN TIME SERIES , a software especially design for time series forecasting . At the end it gives a MATLAB code for the moving average forecasting with seasonal indices
Data Collection
We used the quarterly rainfall data from 1995-2005 as the train data, to develope various models. We used 2006-2011 data to test the model. We checked the model graphically.
Experiments
We used various time series models to train the given data. They were:
- Moving average of degree 1 and 2
- Weighted Moving Average
- Double moving average
- Exponent Smoothing
- Double Exponent Smoothing
- Linear Trend Model
- Quadratic Trend Model
- Additive Seasonal Model
- Multiplicative Seasonal Model
- Holt-Winters Model
- Holt-Winters Multiplicative Model
Result and Conclusion
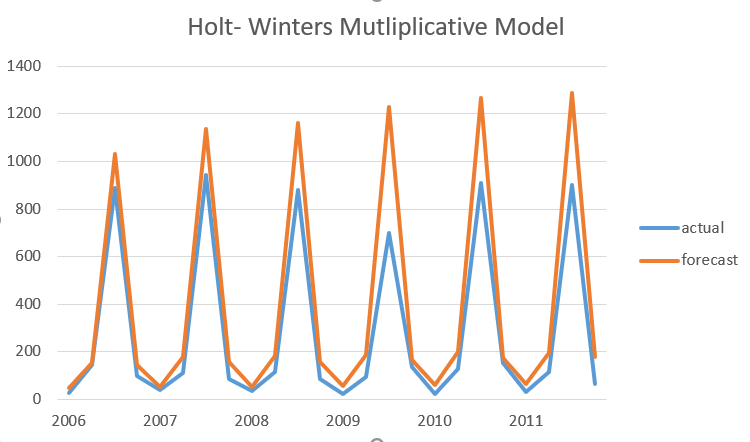
The various models explored and implemented on given rainfall data, along with the visual graphs , give us basic understanding of the working and calculations involved in the shaping the model and how the test set responds to the model. We observe that Holt-Winters Multiplicative Model gives the best test predictions because it takes into account the trend, seasonality as well cyclic properties of the data.